
Smarter Irrigation Decisions with Dragino Soil Sensors
A field can look dry on the surface and still hold enough water below the root zone. Another part of the same field can look fine and be close to stress. That gap between what the eye sees and what the crop feels is where soil sensors become useful.
Dragino soil sensors can help turn irrigation from a fixed routine into a measured decision. By tracking soil moisture, soil temperature, and electrical conductivity, they give a clearer picture of what is happening below the surface. That does not mean a sensor should make every decision on its own. The value comes from placing sensors well, reading patterns over time, and using the data alongside weather, crop stage, soil type, and field experience.

Why irrigation needs more than a calendar
Many irrigation schedules start with a rule of thumb. Water every few days. Run the system for a set number of hours. Increase the time when the weather is hot. Those rules help, but they miss what changes from day to day.
Soil water changes because of:
Rainfall and irrigation events
Crop growth and root depth
Temperature and wind
Soil texture and compaction
Drainage and slope
Fertilizer and salt movement
A sandy area may lose water quickly after irrigation. A heavier clay area may hold water longer but drain more slowly. A low spot may stay wet while a ridge dries out. If every zone gets the same irrigation, some plants may sit in wet soil while others face stress.
A soil sensor does not replace agronomy. It gives a steady view of conditions that are hard to measure by sight. When readings update through a remote network, the data can also reduce unnecessary field checks and show changes between visits.
The goal is simple: apply water when the crop needs it, in the amount the soil can hold, before stress or waste becomes obvious.
What Dragino soil sensors measure
Dragino soil sensors are commonly used in remote monitoring setups, often with LoRaWAN networks. Depending on the model and probe, they can report several measurements that help guide irrigation planning.
Soil moisture shows water availability trends
Soil moisture is usually the first reading people look at. It gives a sense of how much water is present in the soil around the probe.
For irrigation planning, the exact number matters less than the pattern. A single moisture reading can be misleading if the sensor is near a wet pocket, an emitter, a dry clod, or a compacted layer. A week of readings tells a much better story.
Useful moisture patterns include:
A sharp rise after irrigation or rain
A steady decline as roots take up water
No rise after irrigation, which may suggest poor infiltration or sensor placement outside the wetted zone
A very slow decline, which may suggest wet soil, low crop use, or poor drainage
Fast drying after every irrigation, which may point to sandy soil, shallow rooting, or short irrigation runs
Moisture data becomes most useful when linked to real events. Mark irrigation times, rainfall, fertilizer applications, and crop stage changes. Without that context, the graph is harder to read.
Soil temperature affects root activity and water use
Soil temperature influences root growth, nutrient movement, and biological activity. It can also help explain why the same moisture level does not always mean the same crop response.
Cool soil may slow root activity, especially early in the season. Warm soil often lines up with stronger crop water use, especially once the canopy grows. In protected growing, raised beds, orchards, vineyards, and vegetable systems, temperature readings can help explain changes in drying rate.
For example, if moisture falls faster during a warm week than it did during a cool week, the cause may be higher plant water use rather than a leak, a failed irrigation set, or a bad sensor. The temperature trend adds context.
Electrical conductivity helps track salts and nutrients
Electrical conductivity, often shown as EC, measures how easily an electrical current moves through the soil water around the probe. In simple terms, it can reflect the amount of dissolved salts in that soil water. Those salts may come from irrigation water, fertilizers, soil minerals, or past management.
EC is not a full nutrient test. It does not tell exactly which salts are present. Still, it can help flag changes worth investigating.
For irrigation decisions, EC trends can show:
Salt concentration rising as soil dries
Fertilizer movement after fertigation
Possible salt buildup in the root zone
Dilution after rain or heavier irrigation
Differences between areas with different drainage
EC depends on moisture and temperature, so it should not be read in isolation. A high EC reading in dry soil may not mean the same thing as the same reading in moist soil. Watch how EC changes with irrigation events and moisture movement.
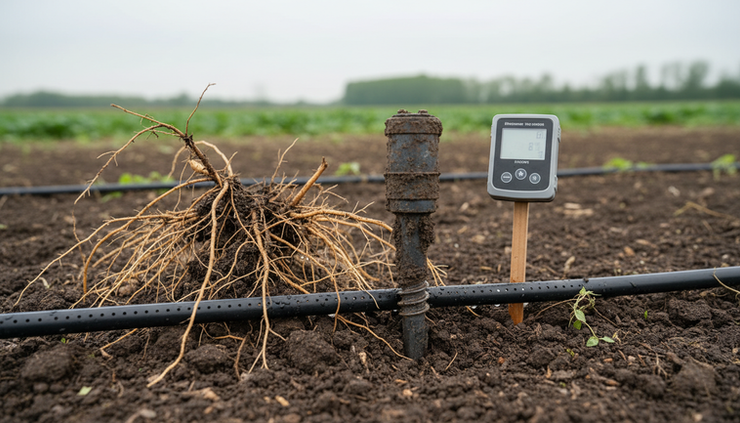
Better sensor placement leads to better decisions
Sensor placement is one of the biggest factors in data quality. A good sensor in the wrong spot can lead to poor irrigation choices.
Start by asking what decision the sensor should support. A sensor for a drip-irrigated vegetable bed may need different placement than a sensor in an orchard block or broadacre field. The aim is to place the probe where it reflects the root zone and the irrigation pattern.
Place sensors where roots are active
The probe should sit in the area where roots take up water. For annual crops, that zone changes as the season develops. Early roots sit shallow. Later roots may explore deeper, depending on crop, soil, and management.
For permanent crops, the active root zone often lines up with the wetted area from drip lines, micro-sprinklers, or rainfall patterns. Placing a sensor far outside that zone may show dry soil even when the crop has enough water where roots are active.
A common approach is to monitor at least one representative depth in the main root zone. In higher-value systems, multiple depths can help show whether irrigation is refilling the root zone or moving beyond it.
Keep distance from emitters in mind
In drip irrigation, soil moisture varies sharply by distance from the emitter. Right next to the emitter, the sensor may show fast wetting and stay wetter than most of the root zone. Too far away, it may show little response after irrigation.
The best location is often within the wetted bulb but not directly against the emitter. The placement should reflect what most roots experience, not the wettest or driest point.
In sprinkler systems, distribution uniformity matters. A sensor near a nozzle overlap, wheel track, or low-pressure area may read differently than the wider block.
Avoid unusual spots unless they are the target
Do not place a main decision sensor in a spot that does not represent the irrigation zone, unless that spot is the specific concern. Avoid locations such as:
Headlands and compacted traffic areas
Field edges with different wind or runoff
Low spots where water collects
Ridges that dry faster than most of the field
Areas near leaks, blocked emitters, or broken sprinklers
Soil patches with a different texture than the rest of the zone
That said, unusual spots can be useful as extra monitoring points. If a grower knows one section always dries first, a sensor there can act as an early warning. The key is to label it correctly and not treat it as the average for the whole field.
Soil variability is the rule, not the exception
No field is perfectly uniform. Soil texture, organic matter, compaction, depth, slope, and drainage can change within short distances. A single sensor can show what happens at one point, not the whole property.
That does not make the sensor useless. It means the sensor must be matched to a management zone.
A management zone is an area that can be irrigated and managed in a similar way. It may be based on soil type, crop age, irrigation layout, slope, or past yield patterns. If two areas dry at different rates but receive the same irrigation, one sensor may not represent both.
A practical setup might include:
Field condition | Sensor approach |
Uniform soil and one irrigation zone | One well-placed sensor may be enough for basic guidance |
Mixed soil textures | Place sensors in the soil types that dry differently |
High-value crop | Use more than one depth or location to reduce guesswork |
Known dry area | Monitor it separately as an early warning point |
Salinity concern | Track EC near the active root zone and compare trends after irrigation |
The number of sensors should match the risk and value of the decision. A low-risk pasture system may need only a simple trend view. A high-value fruit, nut, grape, or vegetable operation may justify more monitoring points because small water mistakes can have larger effects.

Read trends, not isolated numbers
The most common mistake with soil sensor data is treating one reading as a command. Irrigation decisions need context.
A single number may change because of local soil contact, a temporary wet pocket, sensor settling, air gaps, salinity, temperature, or recent irrigation. A trend shows how the soil behaves.
Look for the rhythm of the field:
Moisture rises after irrigation.
Moisture settles as water spreads and drains.
Moisture declines as the crop uses water.
The decline becomes faster or slower depending on weather and growth.
The next irrigation resets the pattern.
Once that rhythm is clear, decisions improve. If each irrigation produces a sharp rise followed by deep drainage, the run time may be too long for that soil. If moisture barely rises, the run time may be too short, the water may not reach the sensor depth, or the sensor may sit outside the wetted zone. If moisture declines to the same low point before every irrigation and plants show stress, the trigger point may be too low.
Compare readings to field observations
Sensor data works best when paired with simple checks.
Dig small inspection holes near the sensor from time to time. Feel the soil. Look at root depth. Check whether wetting patterns match the graph. Watch the crop for stress, color changes, wilting, or uneven growth. Check the irrigation system for pressure, blocked emitters, leaks, and runoff.
These checks help build trust in the data. They also reveal when a sensor has moved, lost good soil contact, or stopped representing the crop zone.
Build trigger points from local patterns
Generic moisture thresholds can be a starting point, but local field patterns are better. A sandy soil, clay soil, shallow-rooted crop, and mature orchard will not share the same ideal trigger.
A practical method is to observe the moisture range over several irrigation cycles:
Note the reading after the soil has drained from a full irrigation.
Note where the crop begins to show mild stress or where drying becomes too fast.
Choose a trigger point above that stress level.
Adjust as roots grow, weather changes, and crop demand increases.
This turns the sensor into a local guide rather than a generic gauge.
How to use Dragino data in daily irrigation planning
Remote sensor readings are most useful when they fit into a regular decision process. The data should answer concrete questions.
Before irrigation, ask:
Is moisture close to the local trigger point?
Is the weather likely to increase crop water use?
Is rain expected soon?
Is EC rising as the soil dries?
Are some zones drying faster than others?
After irrigation, ask:
Did moisture rise at the expected depth?
Did the wetting response happen quickly or slowly?
Did the water move deeper than needed?
Did EC fall, rise, or stay flat?
Did different sensors respond in different ways?
Over time, these answers can shape irrigation duration and timing. They can also reveal system problems. A sensor that stops responding after irrigation may point to a blocked line, dry distribution area, or placement issue. A sensor that stays wet longer than nearby zones may show poor drainage or excess application.
A useful irrigation dashboard is not the one with the most data. It is the one that makes the next decision clearer.
Common mistakes that weaken soil sensor data
Good equipment still needs good setup. Avoid these common problems when using soil sensors for irrigation planning.
Installing without firm soil contact
Air gaps around the probe can distort readings. Install the sensor carefully so the sensing area touches undisturbed soil as much as possible.
Forgetting to record irrigation events
Without event notes, moisture changes become harder to interpret. Keep a simple log of irrigation times, rainfall, fertigation, and system issues.
Moving sensors too often
Frequent moves make trend data less useful. If a sensor must be moved, treat the new location as a new data history.
Comparing unlike locations
A sandy ridge and a heavier low area may show very different readings. Compare locations only when the soil and irrigation conditions are similar.
Reacting to every small fluctuation
Small changes happen. Focus on meaningful shifts over hours and days, not every minor movement in the graph.

A practical way to start
A good first setup does not need to be complicated. Start with one irrigation zone that matters, then learn how the soil responds.
Choose a representative location, install the probe carefully, and collect data through several irrigation cycles. Keep notes on irrigation timing, rainfall, and crop condition. After a few weeks, review the pattern. Look for how quickly the soil wets, how fast it dries, and whether the crop shows stress before the next irrigation.
Once that pattern makes sense, expand only where more data will improve decisions. Add a sensor in a lighter soil, a heavier soil, a known dry area, or a deeper root zone. Each added sensor should answer a real management question.
The strongest irrigation plans use both measurement and judgment. Dragino soil sensors provide the measurement. Field knowledge provides the judgment. Together, they help irrigation become more timely, more consistent, and better matched to what the crop and soil are actually doing.


Comments