
Key Components of a Measurement Instrument Explained
A measurement instrument looks simple from the outside. A pressure gauge shows a needle. A thermometer shows a number. A weighing scale gives a reading. Yet behind that result is a chain of parts that must work together with care.
At its most basic, a measurement instrument does three things:
It detects a physical condition.
It prepares that detected change so it can be used.
It presents the result in a form people or systems can understand.
Those three jobs are usually handled by the sensor, the amplifier or conditioner, and the display. Some instruments also include a recorder so the measurement can be tracked over time.
Understanding these components helps explain why some instruments are highly precise, why others drift, and why a reading is only as reliable as the system that produces it.

A measurement instrument is a chain of functions
A measurement instrument is not just the part that shows the value. It is a complete path from the process being measured to the final reading.
For example, imagine measuring the temperature of water in a tank. The instrument must first sense the water temperature. Then it must convert that condition into a usable signal. After that, the signal may need to be strengthened, filtered, corrected, or converted. Finally, the measurement appears as a number, pointer position, chart, or digital record.
The chain usually looks like this:
Stage | Main job | Simple example |
Sensor | Detects the physical quantity | A thermocouple responds to heat |
Amplifier or conditioner | Prepares the signal | A circuit strengthens a small voltage |
Display or recorder | Shows or stores the result | A screen shows 72 °F |
Each part affects the quality of the final measurement. A good display cannot fix a poor sensor. A sensitive sensor can still give bad results if the signal is noisy. A well-conditioned signal loses value if the display is hard to read or poorly calibrated.
That is why measurement instruments are best understood as systems, not single parts.
The sensor detects the physical change
The sensor is the part of the instrument that first responds to the condition being measured. It sits closest to the process, material, environment, or object under observation.
A sensor changes one of its physical or electrical properties when the measured quantity changes. That change could involve resistance, voltage, current, pressure, displacement, light intensity, or another property.
Common examples include:
A thermistor changing resistance as temperature changes
A strain gauge changing resistance when stretched
A pressure sensor deforming under force from a gas or liquid
A photoelectric sensor changing output when light intensity changes
A pH electrode producing a voltage related to acidity
The sensor does not always produce a value that is ready to read. In many cases, it produces a very small change. A thermocouple, for instance, generates a small voltage when two different metals experience a temperature difference. That tiny voltage must be handled carefully before it can become a useful temperature reading.
Sensors convert process conditions into signals
Most modern instruments need to turn a physical condition into an electrical signal. This makes the measurement easier to transmit, process, display, and record.
The conversion process is called transduction. A device that performs this conversion is often called a transducer. In practical use, people sometimes use the words sensor and transducer in similar ways, though there is a small difference. The sensor responds to the physical condition. The transducer converts that response into a signal.
For example:
Measured quantity | Sensor response | Possible output |
Temperature | Change in voltage or resistance | Electrical signal |
Pressure | Deformation of a diaphragm | Voltage or current signal |
Level | Change in capacitance or ultrasonic distance | Electrical signal |
Flow | Rotation, pressure drop, or heat loss | Pulse or analog signal |
A good sensor should be sensitive enough to detect the quantity of interest, but not so sensitive that it reacts strongly to unwanted influences.
Sensor placement matters
Even a high-quality sensor can give a poor reading if placed badly.
A temperature sensor mounted near a heat source may not represent the actual process temperature. A flow sensor installed too close to a bend in a pipe may read unstable flow. A vibration sensor attached to a loose surface may measure the mounting problem instead of the machine condition.
Good measurement starts with direct contact, correct location, and proper installation.

The amplifier or conditioner prepares the signal
The signal from a sensor is often too small, too noisy, or too irregular to use directly. The amplifier or conditioner solves that problem.
This stage takes the raw sensor output and makes it suitable for display, recording, or control. In some instruments, this may be a small analog circuit. In others, it may include digital processing, filtering, conversion, and correction.
The main goal is simple: preserve the useful measurement while removing or reducing anything that does not belong.
Amplification makes small signals usable
Many sensors produce very small signals. If that signal goes straight to a display, the reading may be unstable, unreadable, or lost in electrical noise.
An amplifier increases the signal level. This does not mean it improves the sensor itself. It makes the signal easier for the rest of the instrument to use.
For example, a strain gauge used to measure force may produce a tiny resistance change. A bridge circuit and amplifier can convert that change into a stronger voltage signal. That stronger signal can then be scaled into pounds, newtons, or another useful unit.
Amplification must be done carefully. If the amplifier also strengthens electrical noise, the final reading may jump around. Good instrument design balances gain, stability, and noise control.
Conditioning shapes the signal into a useful form
Signal conditioning can include several tasks:
Filtering out unwanted noise
Converting resistance, voltage, or current into another signal type
Linearizing a sensor output that is naturally curved
Compensating for temperature or other outside effects
Isolating the measuring circuit from electrical hazards
Scaling the signal to match the display or controller
A common industrial example is converting a sensor output into a 4 to 20 mA current signal. This type of signal travels well over long cable runs and is widely used in process control. The exact electrical format matters less than the principle. The conditioner turns a raw response into a signal that the next stage can trust.
Filtering helps separate signal from noise
Noise can come from motors, power lines, vibration, cable routing, radio sources, or poor grounding. It may appear as random jumps, waves, spikes, or drift in the measurement.
Filtering reduces unwanted variation. A temperature reading in a large tank may not need to respond instantly to tiny moment-to-moment changes. A filter can smooth the reading and make it easier to interpret. By contrast, a vibration measurement may need fast response because short events matter.
The right amount of filtering depends on the purpose of the instrument. Too little filtering gives a noisy reading. Too much filtering hides real changes.

The display turns data into something understandable
The display is the part people usually notice first. It presents the measured value in a readable form.
A display may be mechanical, analog, digital, or graphical. Its job is not merely to show a number. It must help the user understand the measurement correctly.
Common display types include:
A graduated scale with a pointer
A digital numerical screen
A bar graph
A chart recorder
A touchscreen panel
Indicator lights for limits or alarms
A clear display reduces mistakes. The units should be visible. The scale should match the expected range. The resolution should fit the task. A pressure gauge marked from 0 to 1,000 psi may not be a good choice for a process that normally runs near 15 psi, because small changes become hard to see.
Analog displays show trends at a glance
Analog displays use a pointer, dial, column, or other continuous indication. They are often easy to interpret quickly.
A needle moving upward can show a rising pressure before a person reads the exact number. This makes analog displays useful where trend direction matters. Mechanical gauges, liquid-in-glass thermometers, and dial indicators are familiar examples.
Analog displays do have limits. Parallax error can occur when a scale is viewed from an angle. Fine readings may also depend on the skill of the person reading the instrument.
Digital displays give precise values
Digital displays are common because they give clear numerical readings. They reduce guesswork and can show decimals, units, alarms, and status messages.
A digital thermometer may show 98.6 °F instead of asking the user to estimate between scale marks. A digital pressure transmitter may show the live value and send the same information to a control system.
Yet digital displays can create a false sense of accuracy. A screen that shows many decimal places is not always truly accurate to that level. The real quality of the measurement still depends on the sensor, conditioning circuit, calibration, and environment.
The display must match the use case
A good display is designed around how the measurement will be used.
For routine checks, a simple dial or digital readout may be enough. For process control, the instrument may need alarms, setpoints, and communication outputs. For testing or research, the display may need high resolution, stored data, and export options.
The best display is the one that makes the measurement easy to read without hiding uncertainty or context.
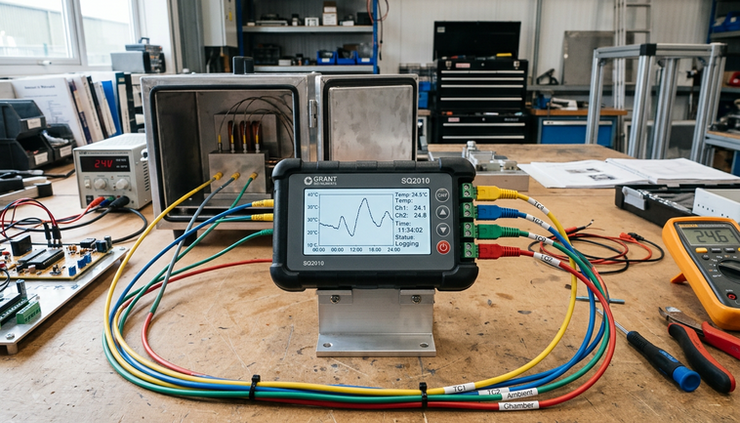
Recorders show what happened over time
Some instruments do more than display the current value. They also record measurement history.
A recorder captures readings over time so users can see patterns, trends, peaks, dips, and faults. This is useful when the measurement changes slowly, when events happen while no one is watching, or when compliance and traceability matter.
Recording can take several forms:
A paper chart in older instruments
Internal digital memory
Data logging to a removable device
Transmission to a monitoring system
Trend graphs on a local display
For example, a temperature recorder in a refrigerated storage area can show whether the temperature stayed within limits overnight. A pressure recorder on a pipeline can reveal short spikes that a person might miss during a manual inspection.
Trend data can be more useful than one reading
A single number tells what is happening now. A recorded trend shows how the process behaved over minutes, hours, days, or longer.
This matters because many problems reveal themselves as patterns. A motor may run hotter each week. A filter may cause pressure to rise slowly as it clogs. A tank level may cycle in a way that points to a control issue.
A recorder makes those patterns visible.
Accuracy depends on the full measuring path
It is tempting to judge an instrument by one impressive specification. In practice, the final reading depends on the complete path from sensor to display.
Several factors can affect measurement quality:
Sensitivity
The instrument must respond enough to detect meaningful changes.
Range
The instrument must cover the expected minimum and maximum values.
Resolution
The display must show changes at a useful level of detail.
Accuracy
The reading should be close to the true value within the stated limits.
Repeatability
The instrument should give the same result when measuring the same condition under the same setup.
Response time
The instrument should react fast enough for the process being measured.
Stability
The reading should not drift without a real change in the measured quantity.
Calibration also plays a major role. Calibration compares the instrument with a known standard and adjusts or documents its error. Without calibration, even a well-built instrument can slowly become unreliable.
A simple example brings the parts together
Consider an electronic weighing scale.
The sensor is often a load cell. When weight is applied, the load cell deforms slightly. That deformation changes the electrical resistance of strain gauges bonded to the cell.
The amplifier and conditioner detect that very small resistance change. The circuit strengthens the signal, filters noise, compensates where needed, and converts it into a value that corresponds to weight.
The display then shows the result, such as pounds or kilograms. If the scale includes memory or a connected system, it may also record readings over time.
The same pattern appears in many instruments:
Instrument | Sensor | Conditioning stage | Display |
Digital thermometer | Temperature probe | Signal conversion and scaling | Numeric temperature |
Pressure transmitter | Pressure sensing element | Amplification and current output | Local screen or control panel |
Weighing scale | Load cell | Bridge circuit and amplifier | Digital weight reading |
Flow meter | Flow sensing element | Pulse shaping or conversion | Flow rate and total |
The instrument may look simple because only the final reading is visible. The reliability of that reading comes from all the stages working together.
Choosing an instrument starts with the measurement goal
Before selecting or evaluating a measuring device, define what the instrument must actually do.
Ask practical questions:
What physical quantity needs to be measured?
What range is expected?
How accurate does the reading need to be?
How quickly must the instrument respond?
Will the environment include vibration, moisture, heat, or electrical noise?
Does the measurement need to be recorded?
Will the signal travel to another system?
These questions guide the choice of sensor, conditioning method, and display type.
For example, measuring room temperature for comfort does not require the same instrument as measuring furnace temperature in an industrial process. Both are temperature measurements, but the sensor materials, signal handling, protection, and display needs are very different.
The core lesson is simple. A measurement instrument is only as strong as its weakest stage. The sensor must respond correctly. The amplifier or conditioner must preserve and prepare the signal. The display or recorder must present the result clearly.
When those parts are matched to the task, the instrument becomes more than a device with a reading. It becomes a reliable link between a real physical condition and a decision someone can trust.


Comments