
How to Interpret ALTA Soil Moisture Sensor Readings for Precision Irrigation
A soil moisture reading only becomes useful when it helps answer one question: does this crop need water now, or can irrigation wait?
The ALTA Soil Moisture Sensor helps answer that question by measuring soil water tension in centibars (cb) or kilopascals (kPa). These readings show how much energy a plant’s roots must use to pull water from the soil. Low readings mean water is easy for the crop to access. Higher readings mean the plant must work harder, and stress may follow if dry conditions continue.
For precision irrigation, the goal is not to react to one number in isolation. The goal is to read the pattern. A single reading tells you the soil’s current condition. A series of readings shows how fast the root zone is drying, when the crop is approaching stress, and when irrigation will do the most good.

What ALTA Soil Moisture Sensor readings actually measure
The ALTA Soil Moisture Sensor measures soil water tension, not just the amount of water in the ground.
That difference matters. Soil can hold water in different ways depending on texture, structure, organic matter, compaction, and drainage. A sandy soil may release water quickly. A clay soil may hold water more tightly. The plant does not care only how much water exists in the soil. It cares how hard it is to extract that water.
That extraction effort is what soil water tension represents.
A lower cb or kPa value means roots can pull water with little effort. A higher value means the soil is holding water more tightly, so the plant must use more energy to access it. When readings rise too far or too fast, the crop can begin to experience water stress, even if the soil still contains some moisture.
For practical use, centibars and kilopascals are often read as matching values in this context. A reading of 30 cb corresponds to 30 kPa on the guideline scale. That makes interpretation straightforward when moving between the two units.
Use the guideline ranges as a starting point
The following ranges provide a useful baseline for interpreting ALTA Soil Moisture Sensor readings. They are general guidelines, not fixed irrigation rules for every field.
Reading in cb or kPa | General soil moisture condition | What it usually means |
0 to 10 | Saturated soil | Soil is very wet, often near or after irrigation or rainfall |
10 to 30 | Adequately wet soil | Good moisture for many soils, though coarse sands may already begin losing available water |
30 to 60 | Usual irrigation range for most soils | Many crops and soils approach the practical point to irrigate |
60 to 100 | Usual irrigation range in heavy clay | Clay soils may hold usable water at higher tension than lighter soils |
100 to 200 | Dangerously dry for maximum production | Crop stress risk rises, proceed with caution |
Up to 240 | Upper sensor reading range | ALTA Soil Moisture Sensors can read up to 240 cb or kPa |
The key point is simple: as the number rises, water becomes harder for the plant to access.
In many fields, the 30 to 60 cb range is where irrigation decisions become active. For heavy clay soils, that decision point may sit higher, often in the 60 to 100 cb range. At 100 to 200 cb, the soil is becoming dangerously dry for maximum production, and the crop may already be under meaningful stress depending on crop type, stage, weather, and root depth.

Do not treat one reading as the whole story
A single soil moisture reading can be helpful, especially after irrigation, rainfall, or a period of hot weather. But the most useful insight often comes from comparing today’s reading with readings from three to five days ago.
That comparison shows the rate of change.
For example, imagine one sensor shows 28 cb today. On its own, that looks reasonably wet for many soils. But if that same sensor read 12 cb three days ago, the field is drying quickly. The crop may be using water at a high rate, or the soil may be losing moisture faster than expected.
Now compare that with another field that reads 45 cb today but was at 40 cb three days ago. The number is higher, but the increase is slow. That field may not need immediate irrigation, depending on the crop, soil type, and forecast.
This is why trend matters so much in precision irrigation. The question is not only, “What is the reading?” It is also, “How fast is it moving?”
A slow increase suggests the soil is drying gradually. A sharp increase means moisture is being depleted quickly. When the reading climbs fast, roots are working harder with each passing day. If irrigation waits too long, the crop may cross from normal water use into stress.
Take two to three readings between irrigations
In many irrigation programs, two to three readings between irrigations are enough to understand the drying pattern. More readings can help in complex fields, but the basic pattern often emerges with a small number of well-timed measurements.
A practical schedule may look like this:
Take a reading after irrigation has had time to move into the root zone.
Take another reading midway between irrigations.
Take a final reading near the expected irrigation decision point.
This rhythm helps show whether water is lasting as expected. It also helps reveal whether irrigation is too light, too heavy, too frequent, or delayed too long.
If post-irrigation readings remain high, water may not be reaching the sensor depth or the active root zone. If readings drop very low and stay there, irrigation may be exceeding what the crop and soil can use at that time. If readings climb quickly after irrigation, the crop may be using water rapidly, or the soil may have low water-holding capacity.
The best reading schedule is consistent enough to compare patterns over time. Random measurements are better than guessing, but consistent measurements are far more useful.
Chart the readings to spot irrigation timing
Numbers in a logbook help. A graph helps more.
When readings are displayed visually, the drying curve becomes clear. A gentle upward slope shows slow moisture depletion. A steep upward slope shows rapid drying. A sharp drop after irrigation confirms that water reached the sensor area. If the line barely moves after irrigation, it may point to uneven water distribution, shallow irrigation, sensor placement issues, or soil conditions that limit water movement.
iMonnit Software can display ALTA Soil Moisture Sensor data in graphs, which makes it easier to see what is happening across irrigation cycles. Instead of interpreting scattered numbers, the graph shows the full pattern.
Look for these common patterns:
A steady climb
The crop is using water at a predictable rate. Irrigation can often be scheduled with confidence.
A sudden jump upward
The root zone is drying quickly. Heat, wind, crop growth stage, or soil texture may be increasing water demand.
A sharp drop after irrigation
Water likely reached the sensor depth. This is usually expected after an effective irrigation event.
Little change after irrigation
Water may not have reached the monitored zone, or the reading point may not represent the wetted area.
Very low readings for long periods
Soil may be staying too wet. In some crops and soils, this can limit root oxygen and affect root health.

Adjust interpretation for soil type
Soil texture changes how readings behave.
Coarse sands drain quickly and hold less water. In sandy fields, a reading in the 10 to 30 cb range can already mean the soil is beginning to lose available moisture. Waiting for readings to climb much higher may allow stress to develop quickly.
Loams often fit the middle guideline ranges well. Many irrigation decisions in loam soils fall around the 30 to 60 cb range, though crop type and rooting depth still matter.
Heavy clay soils hold water more tightly. They may show higher soil water tension while still supplying the crop with usable moisture. That is why 60 to 100 cb can be a usual irrigation range in heavy clay.
Soil structure also matters. Compacted soil, crusted surfaces, poor drainage, and layered soils can all affect how water moves. One part of a field may dry faster than another, especially where texture changes across the root zone.
For this reason, the best irrigation threshold is rarely copied from another farm. Use the guideline ranges as the starting point, then refine them based on crop response, soil behavior, irrigation method, and local climate.
Match readings to the crop’s root zone
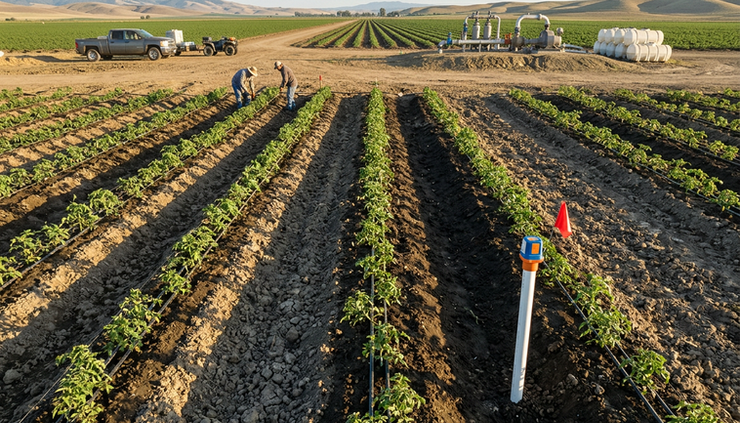
A soil moisture sensor should represent the area where the crop is actively taking up water. If the sensor sits too shallow, readings may swing quickly after light rain or surface evaporation. If it sits too deep, it may miss the moisture conditions affecting most active roots.
Root depth changes through the season. Young plants draw water from a shallower zone. Mature crops often reach deeper, depending on species and soil conditions. That means interpretation may shift as roots develop.
For perennial crops, placement may also depend on the irrigation pattern. A sensor outside the wetted zone may show dry conditions even when roots near the emitter have enough water. A sensor placed too close to an emitter may show wet readings that do not reflect the broader root zone.
Use placement and readings together. If the crop looks stressed but readings stay low, the sensor may not be monitoring the right part of the root system. If readings rise quickly but plants look healthy, the crop may be drawing water from deeper or nearby zones not captured by that sensor.
Turn readings into irrigation decisions
The most useful irrigation decisions combine three things:
The current reading
This shows the present soil water tension.
The recent trend
This shows how fast the soil is drying.
Field context
Soil type, crop stage, weather, irrigation method, and root depth explain what the number means.
For example, a 55 cb reading in a loam soil during a hot, windy week may call for irrigation soon, especially if the reading was 35 cb a few days earlier. A 55 cb reading in a heavy clay soil may be less urgent if the trend is slow and the crop is not near a sensitive growth stage.
The difference between today’s reading and the reading from three to five days ago is often the most valuable clue. A reading that climbs 5 cb over several days tells a different story than one that climbs 30 cb in the same period.
This is where precision irrigation becomes practical. Rather than irrigating only by calendar date, you can irrigate when the root zone shows that water is becoming harder to access.
Common mistakes that make readings harder to use
Even a good sensor can lead to poor decisions if the data is interpreted without context. Watch for these common issues.
Reacting to every small change
Soil moisture readings naturally move. Focus on meaningful changes and trends, not tiny shifts from one reading to the next.
Ignoring soil texture
A number that is safe in clay may be too dry in sand. Always read the value through the lens of soil type.
Skipping post-irrigation checks
A reading after irrigation helps confirm whether water reached the root zone. Without that check, it is harder to know if the irrigation event worked as intended.
Comparing unrelated sensor locations
A sensor in a low spot and a sensor on a slope may behave differently. Compare locations carefully.
Waiting too long at high readings
Once readings reach the 100 to 200 cb range, the soil may be dangerously dry for maximum production. At that point, irrigation may prevent further stress, but it may not fully undo the effects of delayed watering.
A practical way to read the next graph
When reviewing your next soil moisture graph, start with four simple questions:
Where did the reading settle after irrigation?
How quickly did it rise over the next three to five days?
Is the crop entering a high water-use stage?
Is the current reading near the usual irrigation range for this soil?
If the graph rises slowly and remains in a comfortable range, irrigation may wait. If the graph climbs quickly toward the crop’s stress range, it is time to act sooner. If the line does not respond after irrigation, inspect placement, irrigation coverage, and system performance.
The best irrigation schedule is built from repeated observation. Over time, the relationship between readings, weather, crop condition, and yield goals becomes clearer. That history turns the sensor from a simple measuring device into a decision tool.
The takeaway for precision irrigation
ALTA Soil Moisture Sensor readings are most powerful when used as a trend, not a single number. Low cb or kPa readings mean water is easier for roots to access. Higher readings mean the crop must work harder. Rapid increases show fast depletion and possible stress ahead.
Use the guideline ranges to understand the reading, then refine your irrigation timing based on soil type, crop stage, climate, and the rate of change. With two to three readings between irrigations and clear graphs from iMonnit Software, it becomes much easier to see when the root zone is drying and when irrigation will deliver the most value.
The practical next step is simple: chart the readings, watch the slope, and let the crop’s root zone guide the irrigation schedule.


Comments