
Integrating 4G and LoRaWAN Flow Meter Monitoring for Real Time Dashboards and Alerts
- Jul 29
- 10 min read
A flow meter can tell you how much water, fuel, chemical, or process liquid is moving through a pipe. The real value appears when that data leaves the plant room, pump station, field cabinet, or remote chamber and reaches a dashboard in near real time.
Remote flow monitoring turns a basic meter into an operational tool. It can show abnormal night flow, warn of a burst pipe, record consumption by site or asset, and produce reports without manual meter reads. With 4G and LoRaWAN data loggers, this is now practical even where Ethernet and mains power are not available.
The key is choosing the right interface, collecting clean data, and sending it at the right interval for the job.

How flow meter data reaches a remote dashboard
A typical remote monitoring system has five layers:
Flow meter
Measures flow rate, total volume, or both.
Signal interface
Outputs pulse, analogue, or digital communications such as Modbus.
Telemetry device
Reads the signal, timestamps the data, stores it locally, and transmits it by 4G or LoRaWAN.
Cloud platform or server
Receives, validates, converts, and stores the data.
Dashboard and alerts
Displays trends, totals, alarms, and reports for users or connected systems.
The field wiring matters as much as the dashboard. A poor pulse input, noisy analogue loop, or unstable RS-485 network will produce misleading data, regardless of how polished the software looks.
A good integration starts by confirming what the meter can provide. Many mechanical and electromagnetic meters offer one or more of these outputs:
Flow meter output | What it provides | Common use |
Pulse | A fixed number of pulses per unit of volume | Totalised consumption and batching |
Analogue | A variable signal, often 4-20 mA or 0-10 V | Live flow rate |
Modbus | Digital registers for flow, totals, alarms, and diagnostics | Rich data from smart meters |
The best choice depends on the meter, power source, network coverage, reporting needs, and how fast the data must arrive.
Connecting pulse outputs to 4G or LoRaWAN loggers
Pulse outputs are common on water meters, turbine meters, oval gear meters, and many positive displacement meters. They are simple, low power, and well suited to remote monitoring.
The meter produces a contact closure or transistor output each time a set volume passes through it. For example, one pulse might represent 1 litre, 10 litres, or 1 cubic metre. The telemetry logger counts pulses and converts them into volume using a scale factor.
Common pulse signal types
Pulse wiring can vary, so check the meter manual before connecting anything. Typical options include:
Reed switch
A dry contact that opens and closes as the meter turns. It is simple but can suffer contact bounce.
Open collector or NPN transistor
Needs a pull-up voltage from the logger or external circuit.
PNP output
Switches a positive voltage and must match the logger input rating.
Namur sensor
Used in some industrial or hazardous-area applications and may need a compatible input barrier.
For pulse counting, the logger should support debounce filtering, maximum pulse frequency, and tamper detection if the application needs it. Fast meters may produce high-frequency pulses at peak flow, so confirm the input can count without missing events.
Pulse scaling and totalisation
Pulse data is often sent as an accumulated total rather than an instant flow rate. This saves power and bandwidth. The platform can calculate flow rate from the change in pulse count over time.
A simple example:
Meter pulse value is 10 litres per pulse
Logger reports 1,250 pulses
Total volume is 12,500 litres, or 12.5 cubic metres
For billing or compliance-style reporting, never rely only on rate calculations. Store the raw pulse count, scaled total, and timestamp. That gives a clear audit trail if a dashboard calculation changes later.
Pulse monitoring works especially well for:
District metering areas
Irrigation systems
Tenant sub-metering
Rainwater reuse systems
Remote tanks and filling points
Simple water-use monitoring where total volume matters most
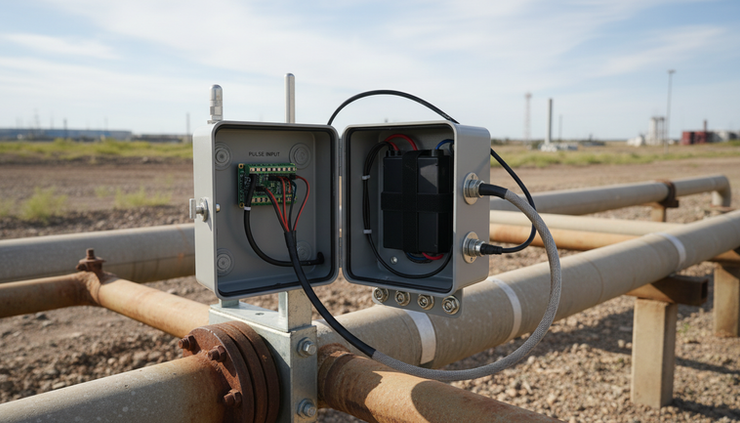
Connecting analogue flow signals
Analogue outputs are useful when the dashboard needs live flow rate rather than only total volume. The most common format is 4-20 mA, where 4 mA represents zero or low range and 20 mA represents the configured full-scale flow.
A flow transmitter might be configured like this:
4 mA equals 0 litres per second
20 mA equals 50 litres per second
The telemetry device reads the current and converts it into engineering units. The calculation must match the transmitter range, not just the meter size. If a mag meter has been configured for 0 to 80 cubic metres per hour, the dashboard must use that same range.
Practical analogue wiring tips
Analogue signals are more sensitive to installation errors than pulse outputs. The biggest issues are power, grounding, and scaling.
Use these checks during commissioning:
Confirm whether the loop is 2-wire loop powered, 3-wire, or 4-wire
Check that the logger input is set for current, not voltage
Confirm the loop supply voltage is high enough for the transmitter and input burden
Use screened cable where electrical noise is likely
Keep analogue cables away from variable speed drive and motor cables
Record the transmitter range in the dashboard configuration notes
Test the reading at zero flow and at a known flow if possible
Analogue is a good fit for pump performance, process monitoring, cooling water, chemical dosing lines, and any application where the rate itself is the main concern.
For battery-powered LoRaWAN devices, analogue monitoring needs careful planning. A 4-20 mA loop consumes more power than a pulse input. The logger may power the sensor only during a short sampling window, then switch it off between readings. That reduces battery use but means the transmitter must stabilise quickly.
With 4G units, power is often less restricted, especially where mains or solar is available. This makes 4G a good choice for higher-frequency analogue data, frequent alarms, and sites that need remote configuration.
Reading flow data over Modbus
Modbus gives the richest connection to a smart flow meter. Instead of counting pulses or scaling one analogue value, the telemetry device can read several registers from the meter.
Common Modbus values include:
Instantaneous flow rate
Forward total
Reverse total
Net total
Signal strength or empty pipe status
Sensor fault codes
Conductivity or temperature, if supported
Meter diagnostics
Most field meters use Modbus RTU over RS-485. Some larger systems use Modbus TCP over Ethernet, but RTU is more common in remote cabinets.
Modbus settings that must match
For RS-485 Modbus to work, every setting must be correct:
Setting | What to check |
Slave address | Each meter on the bus needs a unique address |
Baud rate | Common values include 9,600 and 19,200 baud |
Parity | Must match between logger and meter |
Stop bits | Must match the meter configuration |
Register map | The logger must read the correct register numbers |
Data type | Values may be integer, float, signed, unsigned, or swapped word order |
Termination | Long RS-485 runs may need termination at the ends of the bus |
A common fault is reading the correct register number with the wrong data format. The result may be a value that changes but makes no physical sense. During commissioning, compare the dashboard reading against the meter display at several flow conditions.
Modbus is ideal when the operator wants more than consumption. It supports maintenance planning because diagnostic flags can warn of sensor faults, empty pipe conditions, reverse flow, or signal quality problems.

Choosing between 4G and LoRaWAN
Both 4G and LoRaWAN can send flow data to a remote dashboard, but they solve different problems.
4G monitoring
LoRaWAN monitoring
Best for higher data rates, frequent uploads, remote configuration, firmware updates, and sites with mains or solar power.
Best for low-power metering, long battery life, small payloads, and sites with existing gateway coverage.
4G devices connect through a mobile network and usually send data by MQTT, HTTPS, or a vendor API. They can upload more often and handle richer payloads. A 4G unit can also support local Modbus polling, edge calculations, and alarm logic with fewer bandwidth limits.
LoRaWAN devices send small packets through gateways to a network server, then on to the application platform. This model suits pulse counts, hourly totals, daily totals, and low-frequency analogue readings. It is not designed for constant high-speed process data.
For LoRaWAN, pay attention to:
Gateway coverage at the actual antenna location
Payload size and send interval
Battery size and sensor power needs
Confirmed versus unconfirmed messages
Local buffering if packets are missed
Regional radio rules and duty cycle limits
For 4G, pay attention to:
Signal quality, not just signal bars
Antenna placement and cable loss
SIM management and data plan limits
Fallback behaviour during network loss
Local data storage during outages
Cybersecurity settings, including VPN or private APN where required
A practical rule is simple. If the site needs small metering updates a few times per hour or per day, LoRaWAN may be enough. If it needs frequent diagnostics, remote access, or fast event reporting, 4G is often the safer path.
Building alerts that operators can trust
Real-time alerts are only useful when they are accurate, specific, and rare enough to take seriously. Flow systems can create a lot of noise if thresholds are set without context.
Common alert types include:
High flow
Useful for burst pipe detection, stuck valves, or abnormal process demand.
No flow when expected
Useful for pump failure, blocked filters, closed valves, or empty tanks.
Flow when not expected
Useful for leakage, unauthorised use, or overnight losses.
Reverse flow
Useful for backflow detection and process issues.
Meter fault
Useful when Modbus diagnostics or transmitter status bits are available.
Communication loss
Useful when a logger stops reporting or a gateway goes offline.
Good alarms include time conditions. A high flow for 10 seconds may be normal pump start-up. A high flow for 30 minutes at 02:00 may need action. Use delay timers, deadbands, and schedule-based thresholds where possible.
For water-use monitoring, night-flow analysis is especially useful. Many systems should show very low consumption during closed hours. A steady overnight baseline can point to leakage even when daily totals look normal.
Reporting and dashboard design
A dashboard should answer operational questions quickly. Avoid filling it with every possible signal. Start with what people need to know each day.
Useful dashboard elements include:
Current flow rate
Today’s total
Yesterday’s total
Month-to-date consumption
Rolling 7-day trend
Site comparison chart
Alarm list with status
Last communication time
Battery level or supply voltage
Meter diagnostics where available
Reports can support water management, cost allocation, maintenance, and compliance records. For multi-site estates, automated reports can rank sites by consumption, highlight abnormal use, and show whether repairs reduced demand.
A simple example is an irrigation network with pulse meters on each zone. The dashboard can show daily water use by zone, alert when one zone runs longer than expected, and produce a weekly report for the facilities team. If one zone suddenly uses twice as much water as similar zones, the issue is visible before the next manual inspection.
For industrial cooling water, analogue or Modbus data can show flow instability across shifts. This helps identify blocked strainers, failing pumps, or control valve issues before they affect production.
Implementation tips for reliable field systems
The best remote monitoring projects are built around site conditions, not just datasheets.
Start with a site survey. Confirm the meter type, output signal, power availability, cable route, enclosure space, network coverage, and environmental risks. Water chambers, plant rooms, farms, and pump stations all create different problems.
Key implementation tips include:
Use an enclosure with a suitable IP rating for the location
Fit cable glands correctly and leave drip loops where needed
Mount antennas outside metal enclosures
Keep antenna cables short where possible
Use surge protection on exposed cables
Label every conductor and record meter scaling
Store raw readings as well as calculated values
Test alerts with simulated faults before handover
Set upload intervals based on the decision that data supports
Check time zones and daylight saving settings in reports
Power planning also matters. A battery pulse logger sending hourly totals can run for a long time with the right design. A 4G Modbus gateway polling every minute and transmitting often will need mains, solar, or a large battery system.
Commissioning should include a wet test where possible. Compare the meter display, logger reading, and dashboard value at the same time. If totals differ, check pulse value, units, register mapping, and timestamp handling before leaving site.

Practical examples of remote flow monitoring
A few typical deployments show how the same principles apply across different sites.
Remote agricultural borehole
A pulse output from a mechanical water meter connects to a LoRaWAN logger. The device sends hourly totals and a daily battery reading. The dashboard shows abstraction volume by day and sends an alert if flow continues outside the irrigation schedule.
Industrial process cooling loop
An electromagnetic flow meter sends a 4-20 mA signal to a 4G telemetry unit. The dashboard displays live flow rate, trend history, and high or low flow alarms. Maintenance teams can see early signs of blocked strainers or pump degradation.
Multi-tenant commercial water metering
Several pulse meters connect to multi-channel loggers. The dashboard allocates consumption by tenant area and produces monthly reports. Alerts flag unusual overnight use that may indicate leaks or running fixtures.
Pump station with smart mag meter
A Modbus RTU connection carries flow rate, forward total, reverse total, and meter status to a 4G gateway. The dashboard combines flow with pump run status and raises alarms for no-flow conditions during pump operation.
FAQ
Can any flow meter connect to a remote dashboard?
Most can, if they provide a usable output such as pulse, 4-20 mA, 0-10 V, or Modbus. Older meters with no output may need a retrofit pulse module or replacement register.
Is 4G better than LoRaWAN for flow monitoring?
4G is better for frequent data, Modbus polling, and remote access. LoRaWAN is better for low-power metering with small data packets. The right choice depends on power, coverage, payload size, and alarm speed.
How often should flow data be sent?
For billing-style totals, hourly or daily updates may be enough. For leak detection, process control, or pump monitoring, shorter intervals may be needed. Match the interval to the action the data supports.
What causes inaccurate dashboard readings?
Common causes include wrong pulse scaling, incorrect analogue range, Modbus register errors, missed pulses, poor grounding, unstable power, and unit conversion mistakes.
Do remote flow meters keep data during network outages?
Many telemetry devices include local memory, but capacity varies. For critical sites, choose a logger that buffers timestamped readings and forwards them when the network returns.
The takeaway
Remote flow monitoring works best when the field signal, telemetry network, and dashboard design are treated as one system. Pulse inputs are simple and efficient for totals. Analogue signals give clear live rate data. Modbus adds diagnostics and richer meter information.
4G suits data-heavy and time-sensitive applications. LoRaWAN suits low-power metering across distributed sites. Both can support alerts, reporting, and practical water-use monitoring when installed with sound wiring, correct scaling, and realistic alarm rules.
Start with the meter output, confirm the communications path, then build the dashboard around decisions people need to make. That is how a flow meter becomes a reliable remote monitoring asset.


Comments